Install and run a node
Welcome to the Musashi Dōjō, the testnet and training hall for Ouroboros Leios.
The journey starts by learning to install and run a Leios node — and, for the adventurous, how to register a pool.
The Earth phase — the first of the dojo's five phases of intense experimentation, learning, and development — ran from July to August 2026 and has now concluded.
The Water phase, the second of the five, begins on 11 August 2026. Now is the time to get familiar with this implementation: install a node, join the testnet, and if you run a pool, look at the SPO Rewards Program.
Bring your questions to the dojo floor: join the Musashi Dōjō Discord for advice and guidance when you hit a snag, and to raise any issues, concerns, or bugs you find.
Where to start
- Install and run a node (this page) — get a relay syncing against the testnet.
- Register a stake pool — become a block producer.
The Leios testnet runs pre-release code that is rebuilt and redeployed continuously. Expect the chain to be reset, the configuration to be re-pinned, and these instructions to change constantly. Run it on a throwaway machine or container, not on anything you rely on. Nothing here touches mainnet or real ada.
What to expect in the early days
The testnet opens as a training ground, not a finished product. Expect rough edges, especially at the start — that is the point of practicing in the open.
A rough picture of the early days:
- Run nodes. The first goal is simply a healthy population of nodes following the chain — relays, and a growing number of block producers. Standing one up (this guide) is the most useful thing you can do on day one.
- Load comes from IO — and from you. Leios only does its job under transaction load: endorser blocks get produced and certified when there is enough traffic to warrant them. IO drives a baseline with tx-centrifuge (an evolution of the transaction generator we have run on benchmark clusters for years), injecting transactions so Leios activates under realistic conditions.
- Dapps are welcome. Connect to the testnet and drive your own load — including script execution — to see how your workload behaves under Leios. Heads-up: not all tooling is Dijkstra-era ready yet, so some things may be missing or rough. It may not be a smooth start; that is expected.
- Tool builders are welcome too. If you maintain explorers, indexers, wallets, or SDKs, this is a good time to begin integrating with the Dijkstra era and the Leios testnet — start whenever you see fit. Early feedback is exactly what this phase is for.
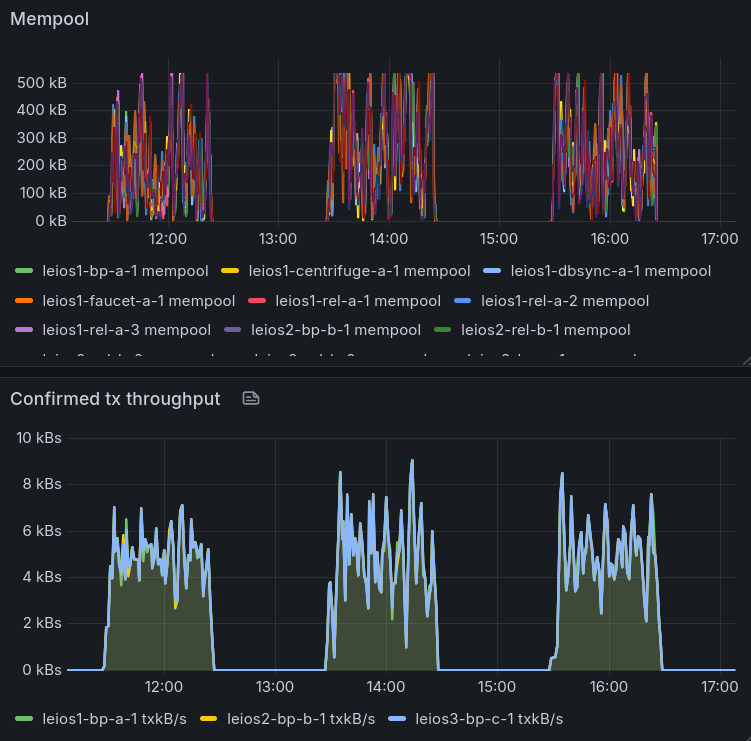
Screenshot of the IO nodes processing an intermittent load. The initial load is ~2x of Praos capacity on a ~1 hour duty cycle.
KleioScan — an early Leios testnet explorer built by Kostas Dermentzis — lets you watch blocks, including endorser blocks, as they land.
The network at a glance
| Network | Ouroboros Leios public prototype testnet |
| Bootstrap relay | leios-node.play.dev.cardano.org:3001 |
| Network magic | 164 |
| Faucet | faucet.leios.play.dev.cardano.org |
| Node releases | https://github.com/input-output-hk/ouroboros-leios/releases |
| Node version | reports cardano-node 11.1.0.164 |
System requirements
The network is fresh and will be respun every couple of weeks. Thus, the load on validating nodes is light by testnet standards — a small machine is plenty, but requires a reasonably fast disk:
| OS / arch | Linux x86-64, Linux aarch64, or macOS aarch64 for prebuilt binaries |
| CPU | 2 cores is fine; more only speeds the initial sync |
| RAM | 4 GB comfortable (the node uses ~2–2.5 GB) |
| Disk | SSD, ~25 GB |
Keep an eye out for these system requirements changing, especially the later phases which will have more load and parameter exploration, which requires more resources. In any case, we would like to hear from your experience running it on your individual hardware or cloud provider.
Run a relay
You need a cardano-node (the Leios prototype) following the testnet as a
relay: a node that syncs the chain but does not produce blocks. Get
this stable before adding block-producer credentials in the
next guide.
A few ways to start one — pick whichever fits your setup:
- Nix — one command builds, installs, and runs the node together with a Grafana + Loki + Prometheus stack. Every dependency is provided.
- Prebuilt binaries — download the release tarball (Linux x86-64, Linux aarch64, or macOS aarch64) and run with the repository's launch script. Compatible with the same observability stack if you install the extra tooling, or run the node on its own and bring your own tools.
- Docker — the same binaries packaged as a container image, for setups that already orchestrate nodes that way. No observability stack included.
Then continue to Confirm you are syncing.
Nix
Nix installs the node and all of its dependencies reproducibly.
1. Install Nix with flake support. Any recent installer will do — the official installer or Determinate Systems' both enable flakes out of the box. The first time you run a flake-based command Nix will ask whether to accept its substituter settings — say yes so the IOG binary cache from our flake kicks in. To skip the prompt once and for all, add this to your nix.conf:
accept-flake-config = true
2. Run the relay. A single command runs a fully provisioned relay — the node, a live tip-watcher, and the observability stack — with no clone required:
nix run github:input-output-hk/ouroboros-leios#leios-testnet-relay
With the cache in play this should be a few minutes of downloads, not hours of compilation.
If it starts compiling cardano-node from source
The flake-config trust didn't apply — usually because your user isn't
in trusted-users on a multi-user install, so the daemon ignores the
flake's substituter settings and falls back to no cache. Add the cache
to your global config and restart the daemon:
echo "extra-substituters = https://cache.iog.io" | sudo tee -a /etc/nix/nix.conf
echo "extra-trusted-public-keys = hydra.iohk.io:f/Ea+s+dFdN+3Y/G+FDgSq+a5NEWhJGzdjvKNGv0/EQ=" | sudo tee -a /etc/nix/nix.conf
sudo systemctl restart nix-daemon
The IOG Nix setup guide covers the full configuration.
The node binds to 0.0.0.0:3010 and keeps its database, socket, and
log under ./tmp-testnet in whatever directory you ran the command
from. Export that so the rest of this guide can refer to it generically:
export WORKING_DIR="$PWD/tmp-testnet"
A Grafana dashboard also opens at http://localhost:3000 — see
Out-of-the-box observability for what
it gives you. Head to Confirm you are syncing.
To use cardano-node and cardano-cli directly (for example, to register a
pool later), you may want to use this nix dev shell:
nix develop github:input-output-hk/ouroboros-leios#dev-testnet
cardano-node --version   # expect: cardano-node x.y.z.164
Prebuilt binaries
The release ships a tarball per platform with cardano-node and
cardano-cli under bin/. On Linux x86-64 and aarch64 the binaries are
statically linked; on macOS aarch64 the dylib paths are pre-rewritten
so they run on a stock macOS host. Either way, nothing else needs
installing.
1. Pick a working directory. Everything for this relay — binaries, config, database, socket, log — lives here.
export WORKING_DIR=~/leios-testnet
mkdir -p "$WORKING_DIR"
2. Download the release tarball and verify the checksum.
- Linux x86-64
- Linux aarch64
- macOS aarch64
cd "$WORKING_DIR"

BASE=https://github.com/input-output-hk/ouroboros-leios/releases/download/prototype-2026w30
ARCHIVE=cardano-node-leios-x86_64-linux.tar.gz
CHECKSUM=cardano-node-leios-x86_64-linux.sha256
curl -L -O "$BASE/$ARCHIVE"
curl -L -O "$BASE/$CHECKSUM"
sha256sum -c "$CHECKSUM"
cd "$WORKING_DIR"

BASE=https://github.com/input-output-hk/ouroboros-leios/releases/download/prototype-2026w30
ARCHIVE=cardano-node-leios-aarch64-linux.tar.gz
CHECKSUM=cardano-node-leios-aarch64-linux.sha256
curl -L -O "$BASE/$ARCHIVE"
curl -L -O "$BASE/$CHECKSUM"
sha256sum -c "$CHECKSUM"
cd "$WORKING_DIR"

BASE=https://github.com/input-output-hk/ouroboros-leios/releases/download/prototype-2026w30
ARCHIVE=cardano-node-leios-aarch64-darwin.tar.gz
CHECKSUM=cardano-node-leios-aarch64-darwin.sha256
curl -L -O "$BASE/$ARCHIVE"
curl -L -O "$BASE/$CHECKSUM"
shasum -a 256 -c "$CHECKSUM"
You should see cardano-node-leios-…tar.gz: OK. If you see FAILED,
delete the files and download them again.
3. Extract and put the binaries on your PATH. The tarball
unpacks straight into bin/.
tar -xzf "$ARCHIVE"
export PATH="$WORKING_DIR/bin:$PATH"
Confirm cardano-node --version reports a version with .164 suffix - this
marks the Leios prototype build.
4. Get the testnet configuration. Fetch the pin script and run it —
it downloads the musashi config (the node configuration
(config.json), topology (topology.json) that points at the public
bootstrap relays, and the era genesis files) from
book.play.dev.cardano.org
into ./config/. Edit any of these locally if you want to experiment:
cd "$WORKING_DIR"
curl -LO https://raw.githubusercontent.com/input-output-hk/ouroboros-leios/main/testnet/pin-config.sh
bash pin-config.sh
5. Start the relay. Launch cardano-node as a non-producing relay,
bound to 0.0.0.0:3010, with $WORKING_DIR holding its database,
socket, and log:
cd "$WORKING_DIR"
mkdir -p db
cardano-node run \
  --config config/config.json \
  --topology config/topology.json \
  --database-path db \
  --socket-path node.socket \
  --host-addr 0.0.0.0 \
  --port 3010 \
  2>&1 | tee -a node.log
Within a few seconds you will see the node connect to peers and begin
adding blocks (AddedToCurrentChain). The socket lands at
$WORKING_DIR/node.socket and the log at $WORKING_DIR/node.log.
This runs in the foreground and streams log lines. To leave it running while you
work in the same terminal, start it under a terminal multiplexer such as tmux
or wrap it into a systemd service.
Docker
A prebuilt image carrying both cardano-node and cardano-cli is published for
each leios prototype release at
ghcr.io/input-output-hk/ouroboros-leios/cardano-node-testnet:prototype-2026w30
— useful if you already orchestrate nodes with containers. The image runs as a
non-block-producing relay out of the box; no observability stack is included.
Pick a host working directory, pull the pinned musashi config, and start the container mounting both:
export WORKING_DIR=~/leios-testnet
mkdir -p "$WORKING_DIR"
cd "$WORKING_DIR"

curl -LO https://raw.githubusercontent.com/input-output-hk/ouroboros-leios/main/testnet/pin-config.sh
bash pin-config.sh

docker run -d --name leios-relay \
  -p 3010:3010 \
  -v "$WORKING_DIR:/data" \
  -v "$WORKING_DIR/config:/app/config:ro" \
  ghcr.io/input-output-hk/ouroboros-leios/cardano-node-testnet:prototype-2026w30
The $WORKING_DIR mount keeps the database, socket ($WORKING_DIR/node.socket),
and log on the host across container restarts. The image also ships a pinned
copy of the same config inside, so the -v $WORKING_DIR/config:/app/config:ro
mount is optional — drop it to fall back to the in-image snapshot.
Follow the running container with docker logs -f leios-relay.
Confirm you are syncing
On the Nix path the relay's process dashboard already shows live sync in its tip-watcher pane:
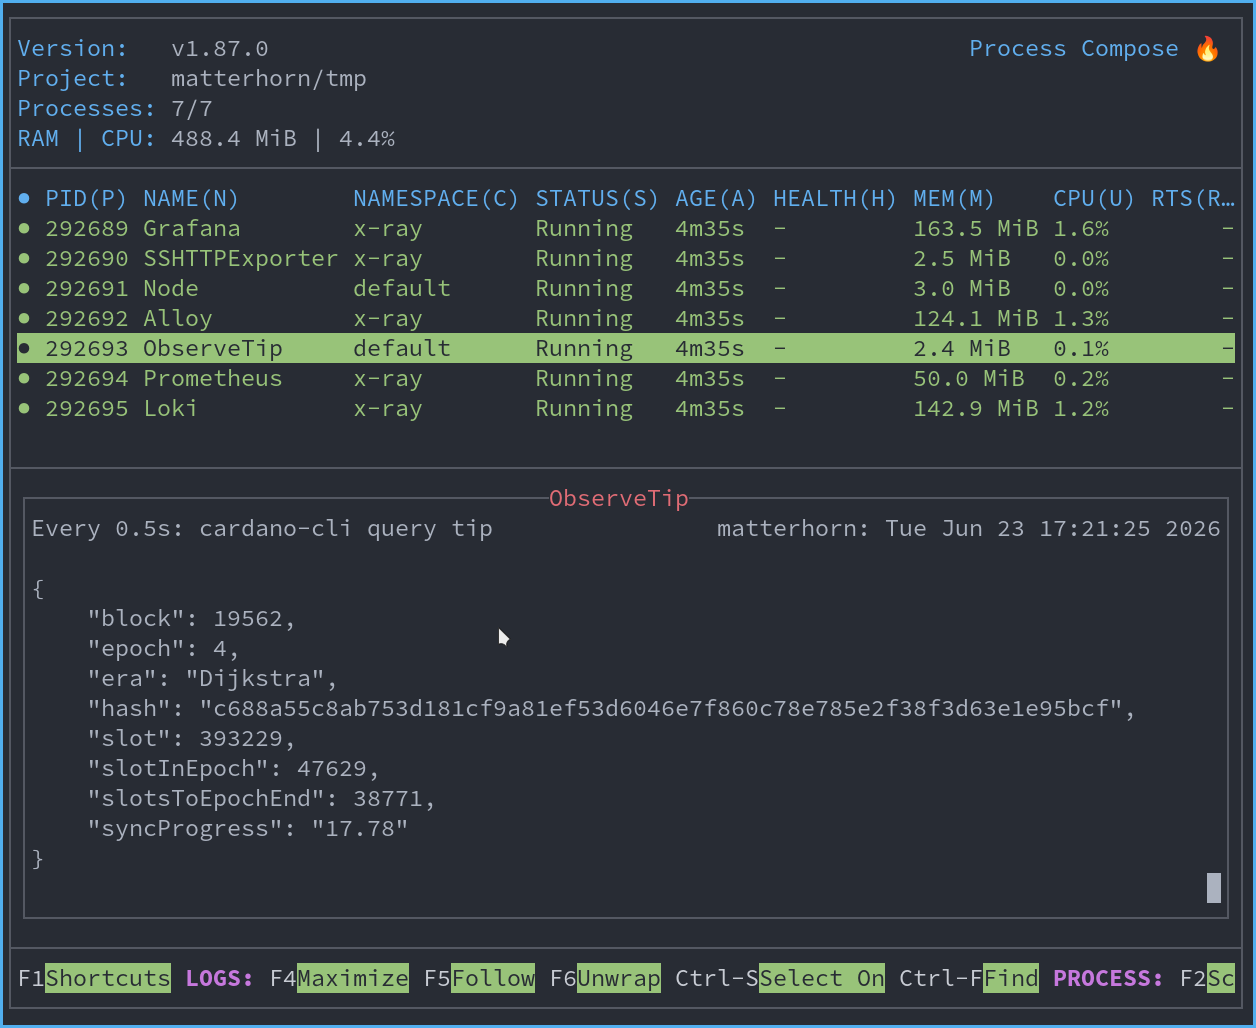
A leios-enabled cardano-node syncing the Musashi network
To query the node yourself, open a second terminal with cardano-cli and
$WORKING_DIR available, point it at the node's socket, and ask for the chain
tip:
export CARDANO_NODE_NETWORK_ID=164
export CARDANO_NODE_SOCKET_PATH="$WORKING_DIR/node.socket"
cardano-cli query tip
You will see something like:
{
    "block": 48521,
    "epoch": 11,
    "era": "Dijkstra",
    "slot": 969905,
    "syncProgress": "46.36"
}
Run it again every minute — block, slot, and syncProgress should
climb. When syncProgress reads 100.00, your node is fully caught up
and following the testnet.
Catching up through the transaction-heavy part of the chain is slow right now. Two things make it worse in this phase of the testnet:
- Few relays serving blocks. The network is small and sync depends on a handful of peers having the blocks you need. If none of your upstreams have them, the node will sit and wait — sometimes for many minutes — before progress resumes.
- Catch-up isn't optimized yet. A more efficient catch-up path is
on the roadmap; until it lands, expect long pauses and bursty
progress where
syncProgressand the block height sit still, then jump forward.
Your node may also get genuinely stuck. If that happens, give it a while, then try again later when more relays are around. Restarting is fine — it costs the small amount of unwritten state, not the synced chain on disk.
If you keep hitting a wall, please reach out on the Musashi Dōjō Discord — that's exactly the feedback the onboarding phase is here to surface.
Out-of-the-box observability
The Nix path boots a Grafana + Loki + Prometheus stack alongside the
node, so you can watch sync progress, peer activity, and Leios events
without setting anything up. Grafana opens at http://localhost:3000
and gives you:
- a process dashboard showing the node and the tip-watcher (live sync progress) side by side
- Loki-backed log search, so you can filter for Leios events through the UI rather than tailing files
- Prometheus metrics for resource usage, mempool depth, and chain tip
The Prebuilt binaries and Docker paths bring only the node
itself; observability there is whatever you wire up around it. If you
want the same wrapped experience without going all-in on Nix, clone the
repository and run its
testnet/run.sh
— a process-compose script that boots the node together with Grafana
- Loki + Prometheus. It needs
process-compose,envsubst, Grafana, Loki, and Prometheus on yourPATH, all of which thedev-testnetNix dev shell supplies.
What to look for
The pinned configuration turns on debug tracing for the Leios
subsystems, so you can watch endorser blocks move through your node —
either through Loki/Grafana, or by tailing $WORKING_DIR/node.log
directly:
tail -f "$WORKING_DIR/node.log" | grep -E 'Leios'
Greppable highlights:
"kind":"LeiosBlockForged"— an endorser block being produced (block-producer side; at a relay you see the announcement propagate)."kind":"LeiosVoted"/"kind":"LeiosNotVoted"— a voter deciding whether to cast a vote on an endorser block."kind":"LeiosCertified"/"kind":"LeiosBlockCertified"— enough votes accumulated to form a certificate for an endorser block, and the certified block being adopted into chain selection."kind":"LeiosBlockAcquired"/"kind":"LeiosBlockTxsAcquired"— an endorser-block body or its transaction closure arriving from a peer.
If you have the out-of-the-box grafana dashboard or other means to watch the current mempool size, you can see Leios in action:
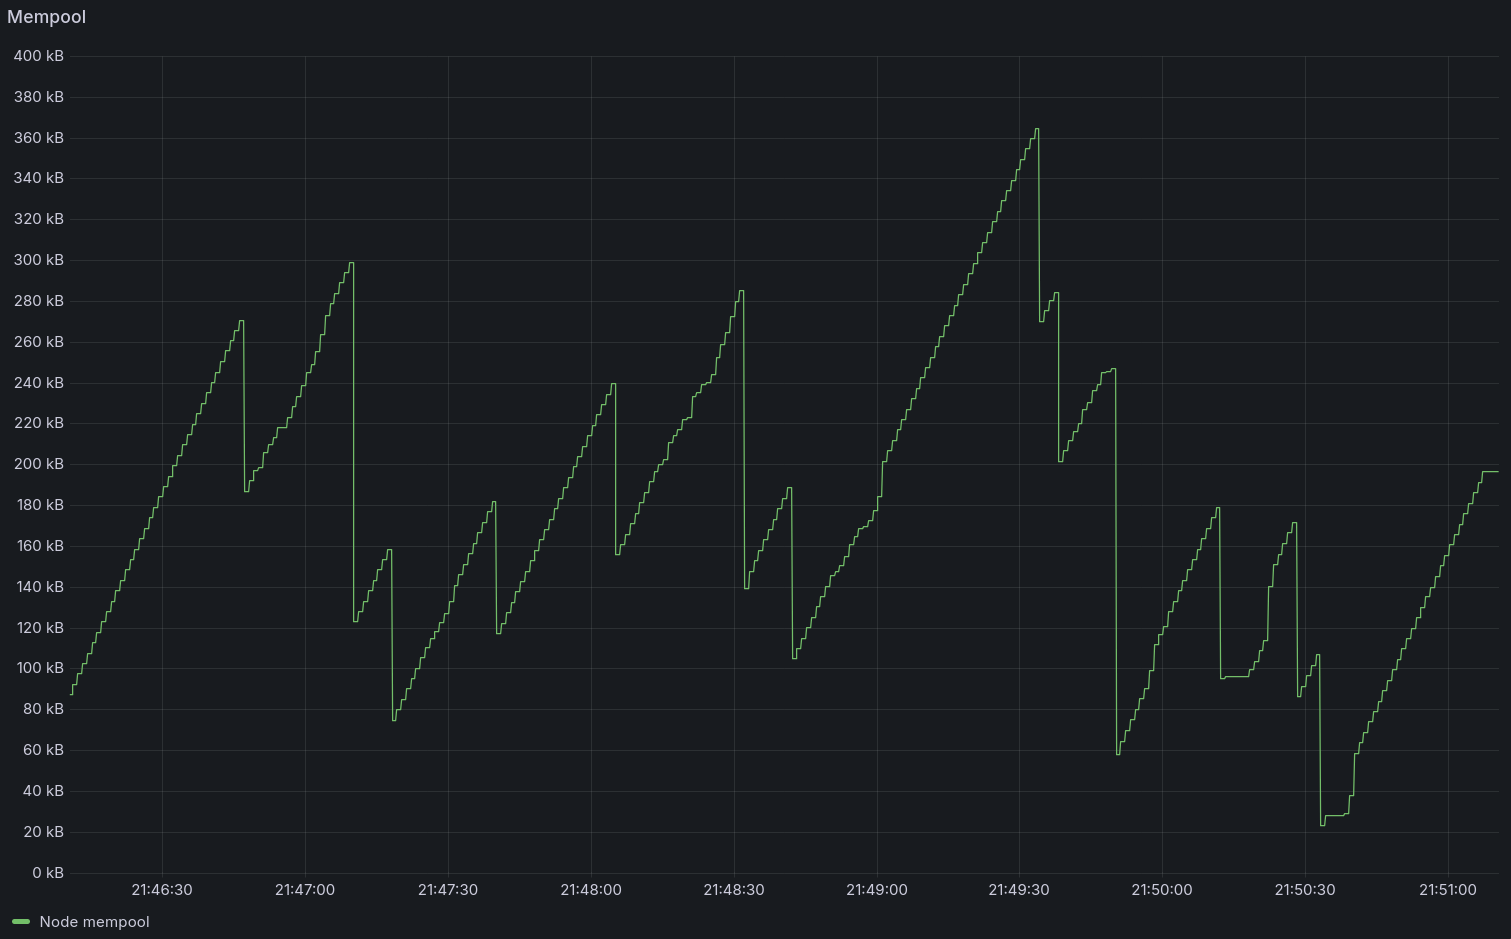
Mempool depleting under load: small spikes down = normal Praos blocks, bigger spikes = Leios EBs via RBs
Seeing these flow through a node you stood up yourself is the protocol behaving in public exactly as the design intends.